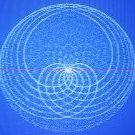
whitesilk Posted August 7, 2018 Zooming out on a quadratic mandlebrot yeilds an interesting image. The red channel is the real value of the complex number. The green channel is the imaginary value of the complex number. the blue channel is the phase of the complex number. it seems to me that right portion of the above image is anthroporphic in a recursive style. Could this mandlebrot set be a map of a human's energy fields? I've heard somewhere that enlightened folk have ten energy centers, and there are three other dots above the crown, in the labeled image. 2 1 Share this post Link to post Share on other sites
whitesilk Posted August 8, 2018 (edited) another view: The first image is sampled with a 64 length series and the colors are taken from the last number in the series. The second image is sampled with a 64 length series and the colors are taken from the peak number or maximum of the series. Edited August 8, 2018 by whitesilk 1 1 Share this post Link to post Share on other sites
CityHermit! Posted August 13, 2018 Thanks, I like Mandelbrot's work. Share this post Link to post Share on other sites